Dasheroo Review | Social Media Statistics Dashboard
In this Dasheroo Review we’re going to be looking at it from the perspective of Social Media Statistics as well as an Inbound Marketing Dashboard to monitor your campaigns. You’re going to see how we at VA Staffer personally use Dasheroo to manage our own campaigns and what we also offer our clients to monitor theirs.
The foundation of a business is built by offering to your customers the best service and product you can, given what you know at the time. The search is endless;
- finding the proper tool for the job,
- using it to it’s maximum, and
- always being on the lookout for better and bigger.
Having done everything to the best of our ability here at VA Staffer and using the tools we have available, I’d say we’ve done a great job offering our clients and providing for ourselves the tools to deliver data that drives improvements and growth.
So, when a new piece of software or a new tool surfaces, believe me, we are ON it.
In this Dasheroo Review we’re going to accomplish 2 goals:
- Give an overall view of the benefits and application of Dasheroo
- Show how our clients and we ourselves have capitalized and utilized its functionality
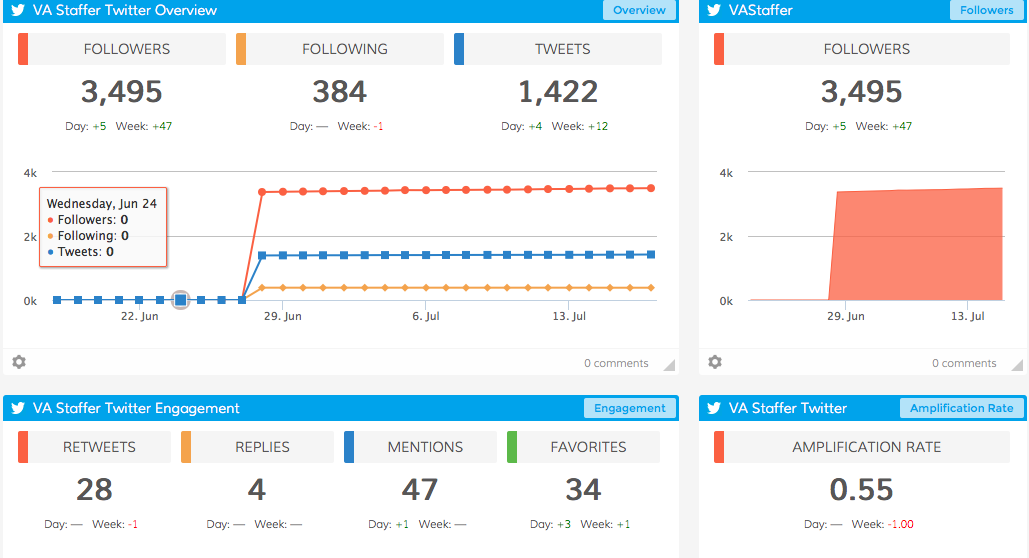
Dasheroo Social Media Statistics Overview
The first and most easily configured feature is using Dasheroo as a Social Media Overview. Once again, it’s very tedious to have to log into each of your social media platforms and monitor you pages and look at your engagement. It is also very time consuming to view each report, and determine campaign progress individually.
With Dasheroo you can see on one page an entire snapshot of all your social media networks.
Do you use any of the following?
Of course, you use one if not several of the above so you’re familiar with logging in, checking your analytics, opening another window and getting more. To start, with this software, you’ll have all of your social media analytics in one place, one page. If you’re running up to 4, you can take 1 glance a day instead of several.
Do you want to see how many people liked your page and how many clicks you received on your campaign this week? BAM!
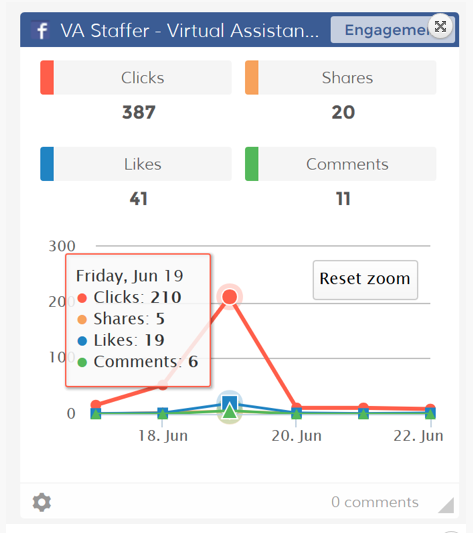
What about your growing Twitter account? Want to see that along with your Facebook to see how it’s performing? Don’t log out – here it is all on one page.
If you’re using social media and other online marketing tools to fuel your business then you’re right on track with the big dogs.
If you’re running several social platforms and blogging, then you’re actually surpassing the average big dog.
However, what separates the crème de la crème are the following major factors:
- Either you’re not doing marketing at all and you’re stagnant
- You’re doing a little marketing and still playing a guessing game with the results or
- You’re wondering how you can improve on your already existing archaic way of tracking effectiveness of all your precious efforts
No matter which of the above camps you’re in, remember, if you’re not testing, you’re not growing. If you’re not measuring, you’re not learning how to grow. It all goes hand-in-hand. You have to know how your efforts are performing or you are taking shots in the dark.
What if you could take all of your social media and inbound marketing efforts and put them all in one dashboard giving you a bird’s eye view of all your metrics in both graphic and numerical format?
What if you could do away with clicking and logging in and closing windows and re-logging in and not to mention, stop taking hours to get all of your metrics in one location for reporting purposes and comparison for an overall view. Being able to see it all in one shot and not closing a window ONCE!
If you’re not familiar with Inbound Marketing then after you’ve done a little homework and discovered that it’s the most effective way of marketing since door to door salesmen with vacuum cleaners, then you’ll understand why this is a no-brainer when it comes to your analytic arsenal.
At VA Staffer, we believe in this product so much so that we use it ourselves and so do our clients. There is no selling needed, just simple screenshots of it’s interface and usability and you’ll be convinced; so let’s begin.
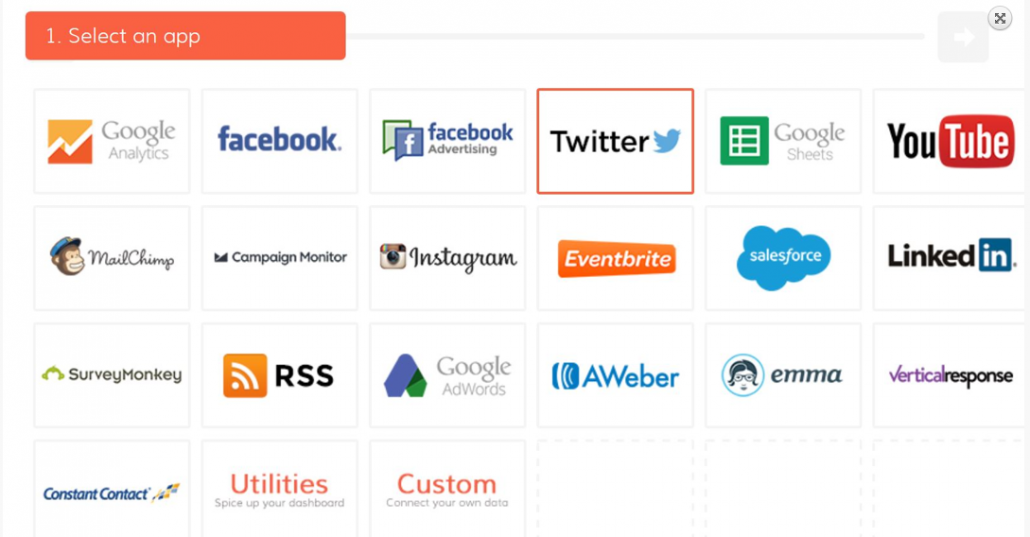
Current Dasheroo Integration with Social Media:
- Facebook Advertising
- YouTube
That’s pretty powerful when you can see that all within a few minutes and then you’re done. Do you have an assistant working for you who needs to compile analytics and deliver to shareholders or the CEO? Getting this together with 1 print screen would delight! And the money you’re saving by not paying someone to compile data for longer than necessary? Well, that speaks for itself.
Even more than that, you can create several different dashboards with its own components for appropriate personnel. So there’s no need to weed through data you don’t need, you can get straight to your dashboard and so can the rest of the team.
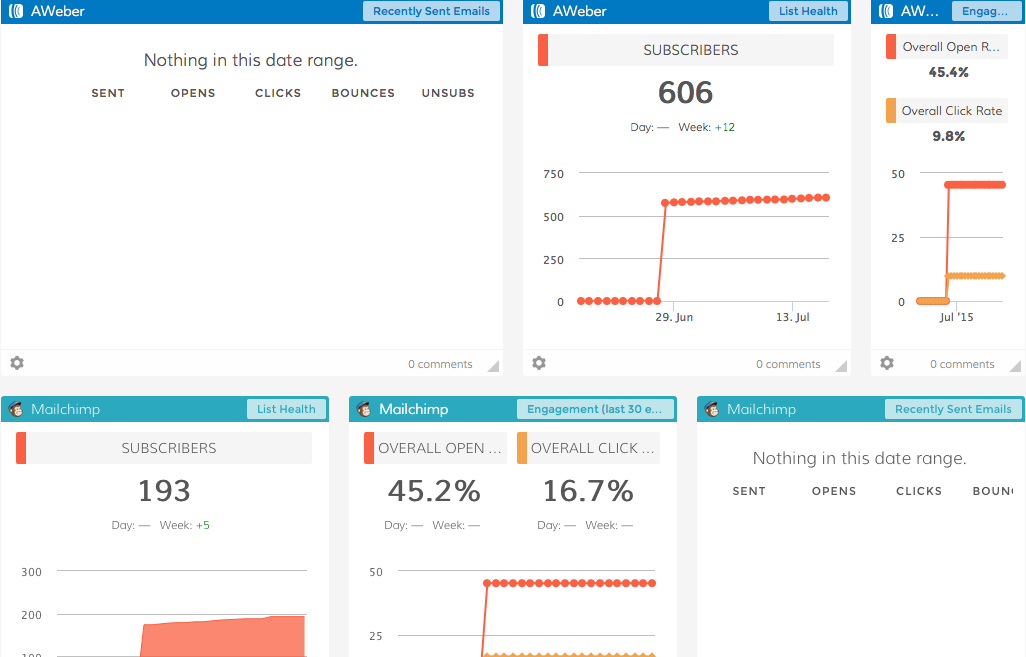
What about your email marketing efforts? Want to see that as well?
Email Marketing Software
Dasheroo easily integrates your email marketing programs on the dashboard.
- MailChimp
- AWeber
- Campaign Monitor
- Emma
- VerticalResponse
- Constant Contact
- GetResponse
Using Dasheroo for Inbound Marketing Campaigns
Like I said above, if you don’t know what Inbound Marketing is and you’re still reading this, then you’re ready to learn. Inbound is using techniques and platforms to get information out which will attract visitors to come in so you don’t have to chase them down – like the vacuum cleaner salesman.
It incorporates the use of blog posts, webinars and the like to give people information, which will lead them to want to engage with you more and eventually buy from you.
Having said that, you can see from the screen shots below that you can check out your top blog posts to see the engagement. This data can be used to promote popular posts more and learn what your target audience likes.
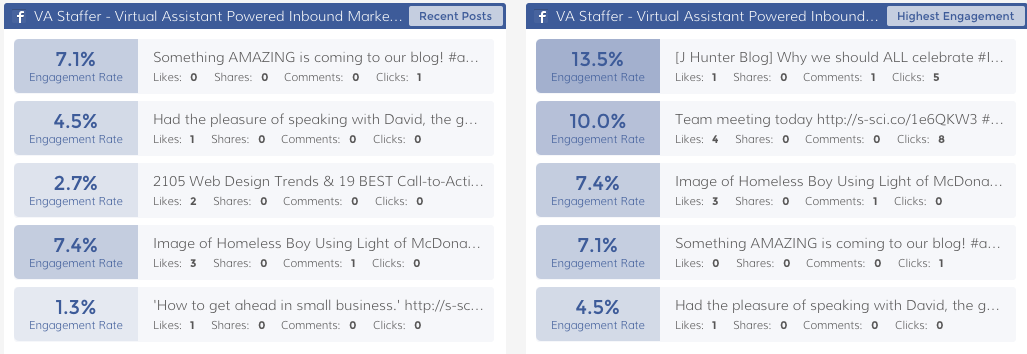
You can pull in all of your Inbound Marketing efforts onto the page as well and see which are performing better than others. Again, you need to see what to change and what to ramp up. Shut the doors or open the floodgates. Analytics and analytical tools are meant to help you grow your business or change your business but only if you are able to disseminate the information.
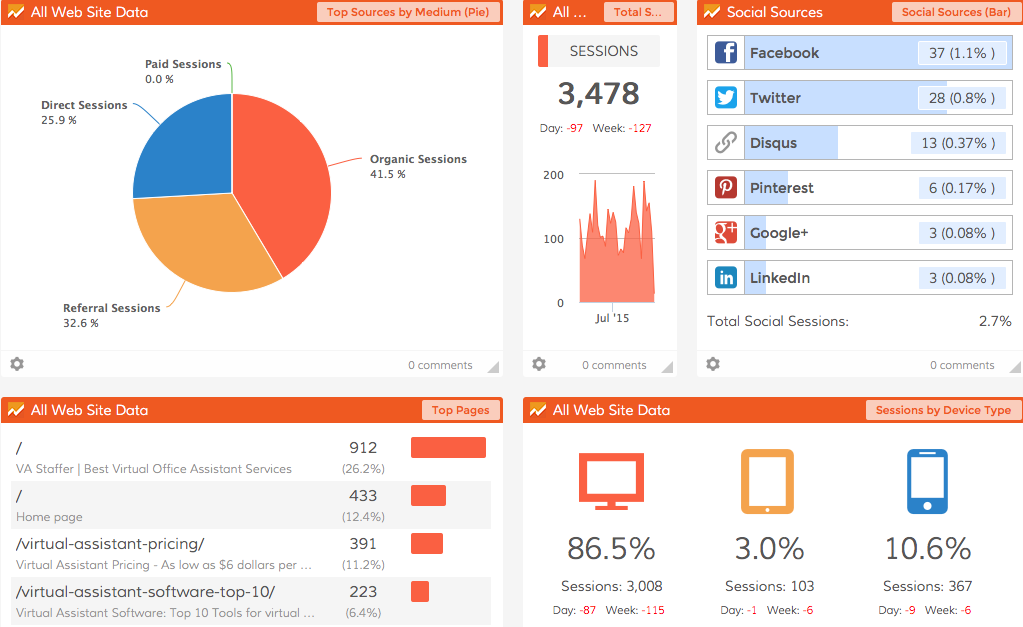
This next shot is going to give you your Google Analytical information at a one glance also. It’s fairly common knowledge that you should be using Google Analytics or some type of analytical software and if you’re not, you’re a few steps behind. It’s easy to install on your site and while Google offers some good data, if you want some user friendly interface software that is incredibly graphic, you’ll want to check out Mouse Heatmap. This analytic tool will completely change the way you take in the data from your website visitors. And the better news is that we’re in talks with Dasheroo right now about getting this ap integrated into the dashboard as well.
Mouse Heatmap is about about as graphically simple as it gets and it’s way of gathering data is unlike the old way of Google analytics reporting and still contains pertinent, vital information for your decision-making. For the most informed decisions, both would be used.
But in the meantime the shot below is the Google Analytics portion of the dashboard.
Here are some additional Dasheroo features that are very impressive and cutting edge:
- Configure your dashboard the way that makes sense to you. You can have your social media at the top and Inbound Marketing lower on the page and if you can’t figure out how to arrange or if you just don’t have the time, you can choose from the premade templates.
- Take two aps and integrate. This creates one graph with 2 sets of data, which will illustrate trends and correlations.
- Communicate with your team. Chat real time to discuss issues or congratulate the team on wins.
With this Dasheroo Review, you should by now be able to determine that having a one page summary of all your analytics and performance data is about as neat and tidy as it gets.
Social Media Statistics are obvious, all in one place and accurate. With the Social Media Overview you’re given in this graphic interface, you can make quick, detailed decisions and stop wasting time constantly clicking and closing. Plus, there’s no more excuses to not go check out your analytic dashboard. It’s all right there. No more putting it off until you’ve let months go by and you forgot to check performance.
It’s critical you check and change on a regular basis and with the use of a few easy to use tools like this one, you can reduce waste, time and frustration.
We reached out to Dasheroo about this blog in advance and they are working on a cool referral program so we can offer special promotions to our readers, but in the meantime you can use it for free anyway…
TAKE BACK YOUR TIME!
Our team can save you a ton of time and energy that can be better spent elsewhere.
You know that already, that’s why you’re here!
